A function to generate approximately equal-area latitudinal bins for a user-specified number of bins and latitudinal range. This approach is based on calculating the curved surface area of spherical segments bounded by two parallel discs.
Arguments
- n
numeric. A single numeric value defining the number of equal-area latitudinal bins to split the latitudinal range into (as defined byminandmax).- min
numeric. A single numeric value defining the lower limit of the latitudinal range (defaults to -90).- max
numeric. A single numeric value defining the upper limit of the latitudinal range (defaults to 90).- r
numeric. The radius of the Earth in kilometres. Defaults to the volumetric mean radius of the Earth (6371 km). Other user-specifiedrvalues are accepted (e.g. equatorial radius 6378 km).- plot
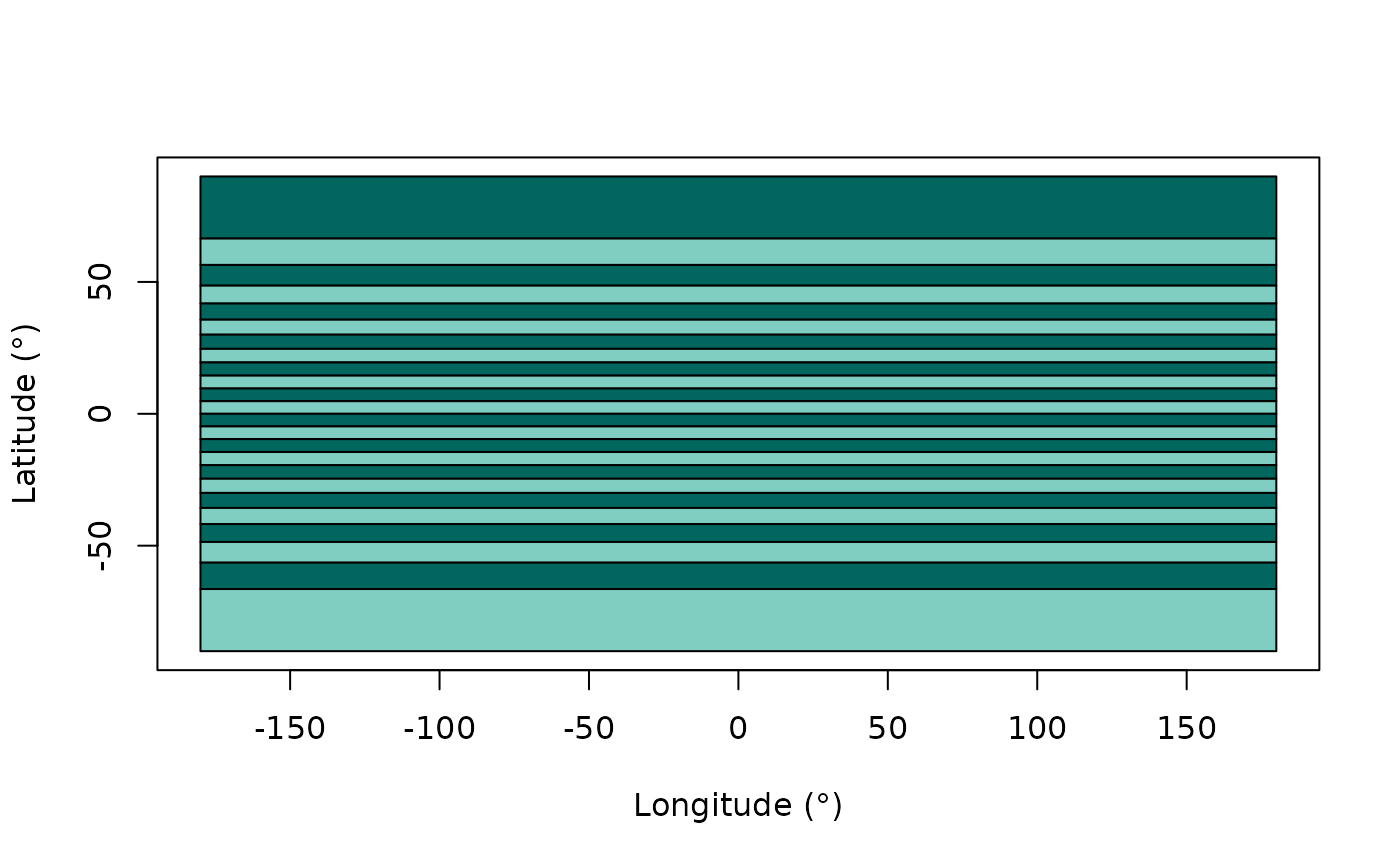
logical. Should a plot of the latitudinal bins be generated? IfTRUE, a plot is generated. Defaults toFALSE.
Value
A data.frame of user-defined number of latitudinal bins. The
data.frame contains the following columns: bin (bin number), min
(minimum latitude of the bin), mid (midpoint latitude of the bin),
max (maximum latitude of the bin), area (the area of the bin in
km2), area_prop (the
proportional area of the bin across all bins).
See also
For bins with unequal area, but equal latitudinal range, see lat_bins_degrees.